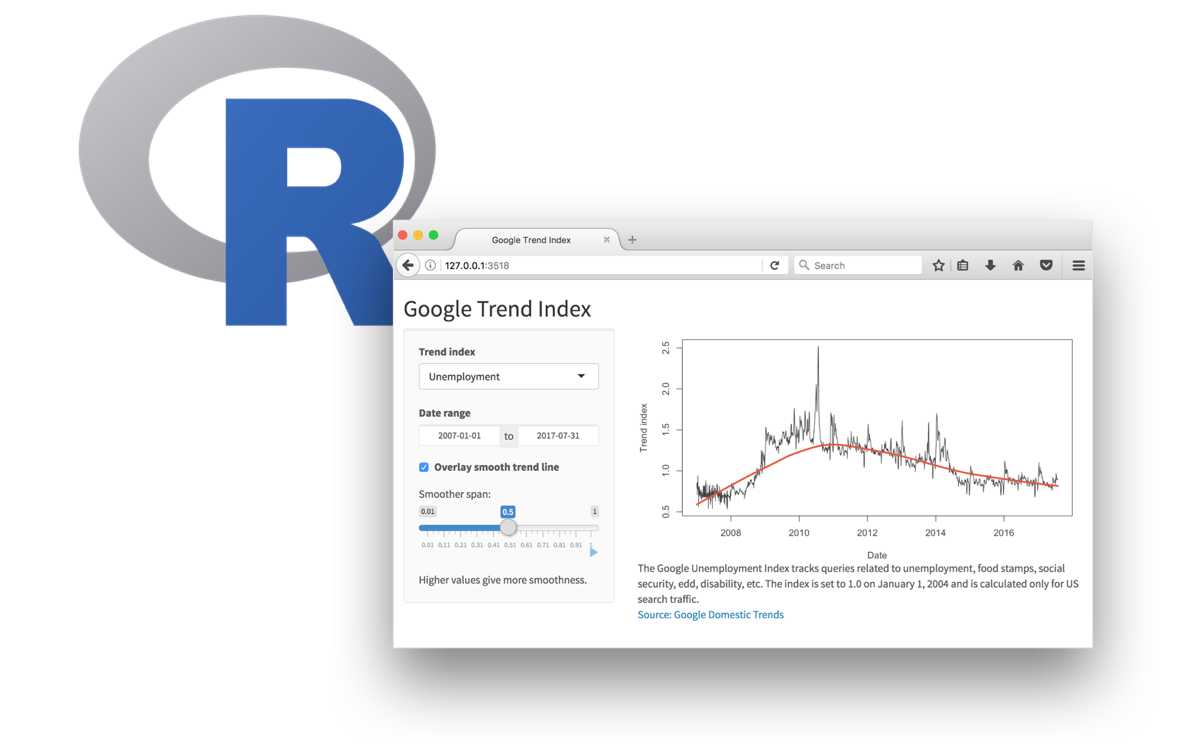
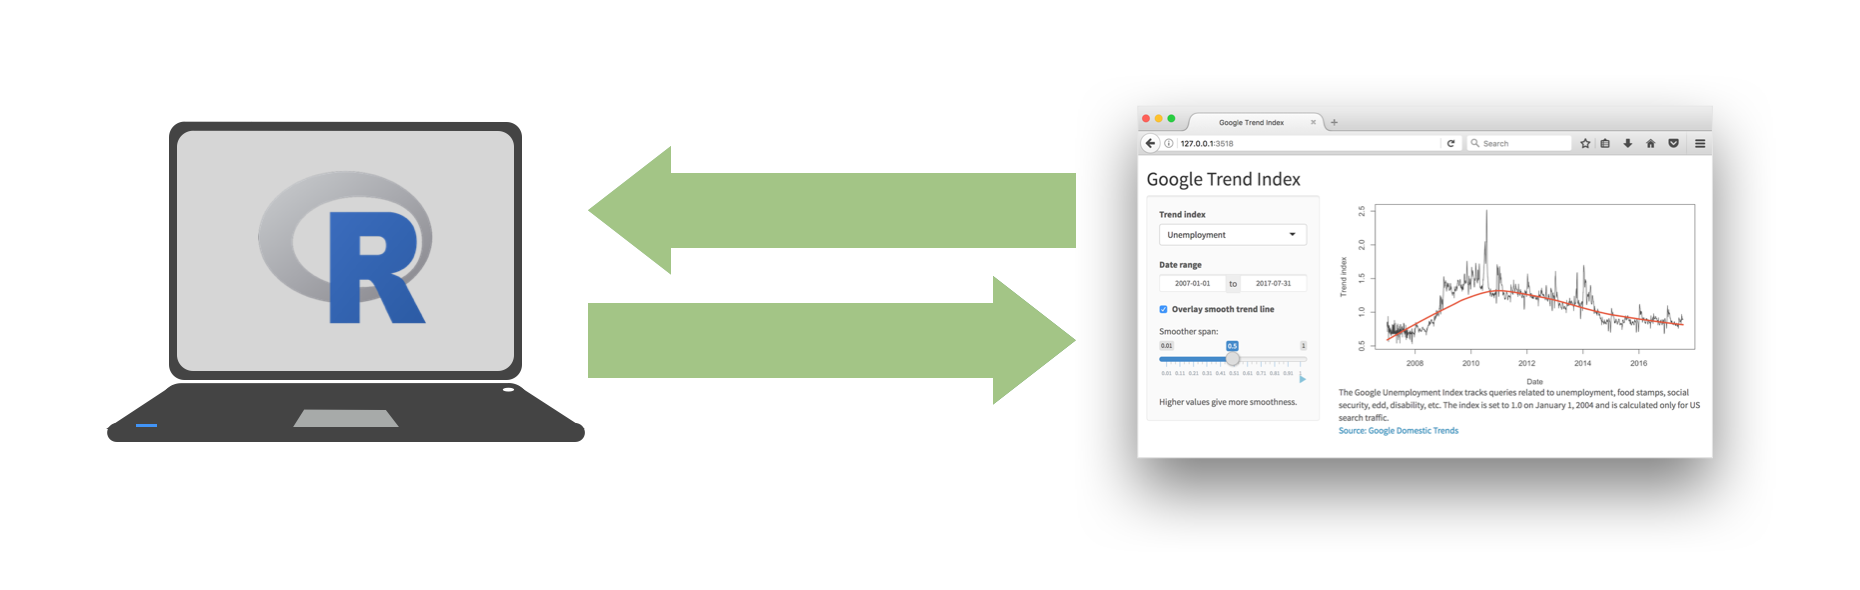
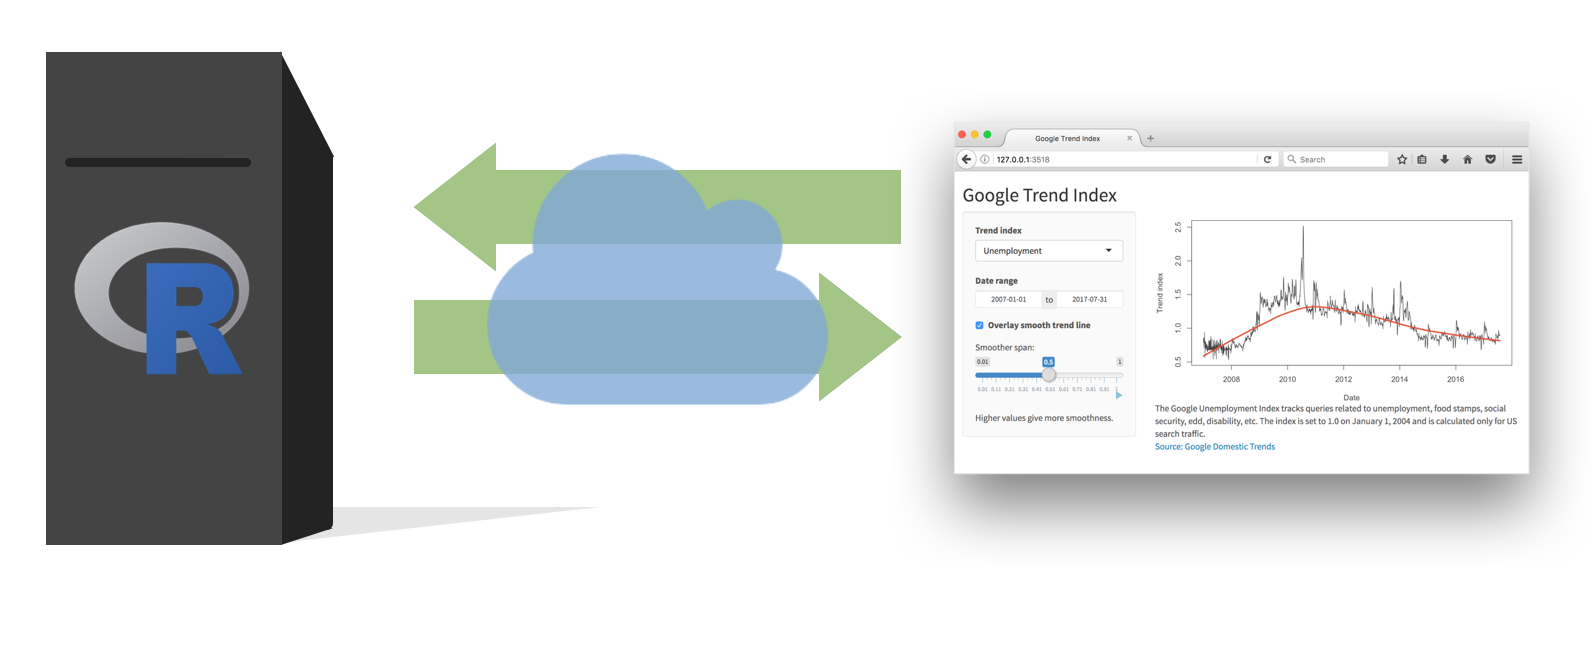
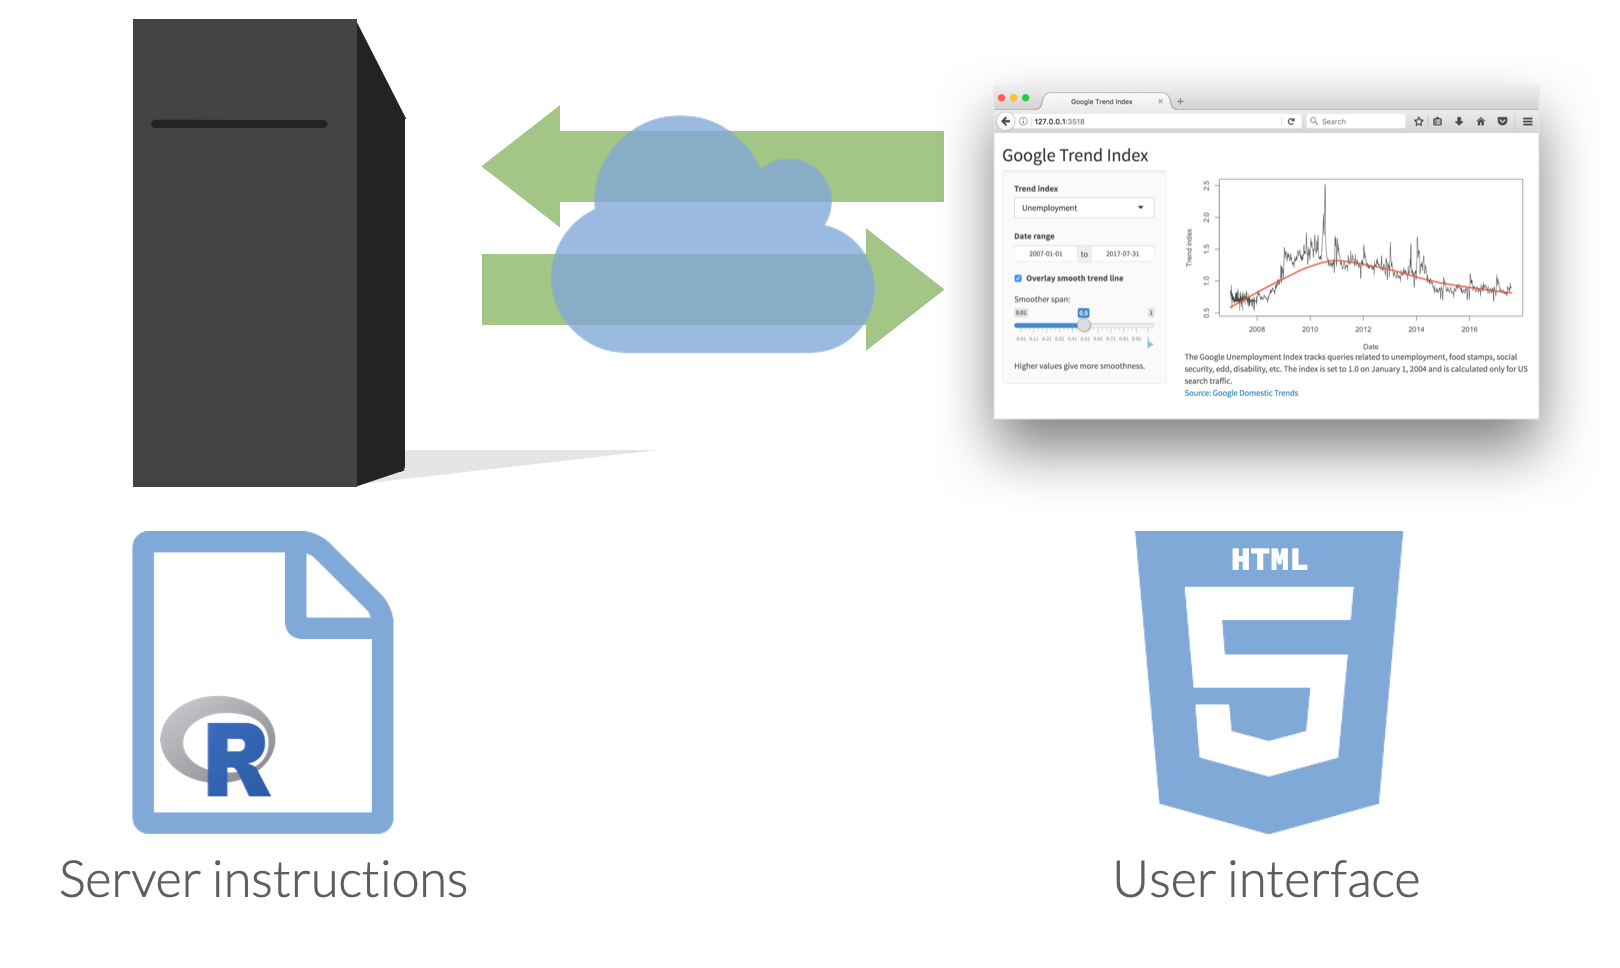
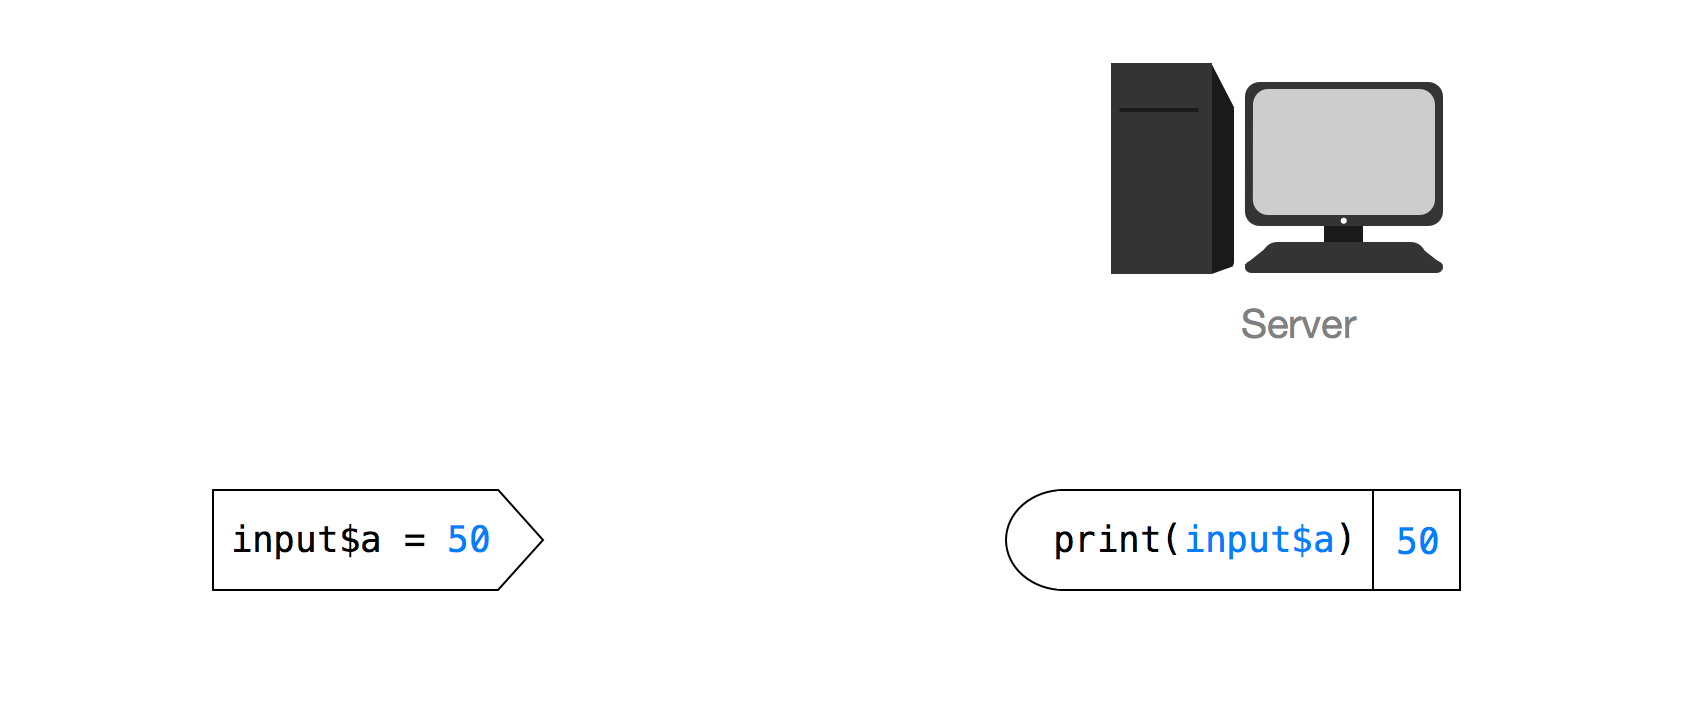
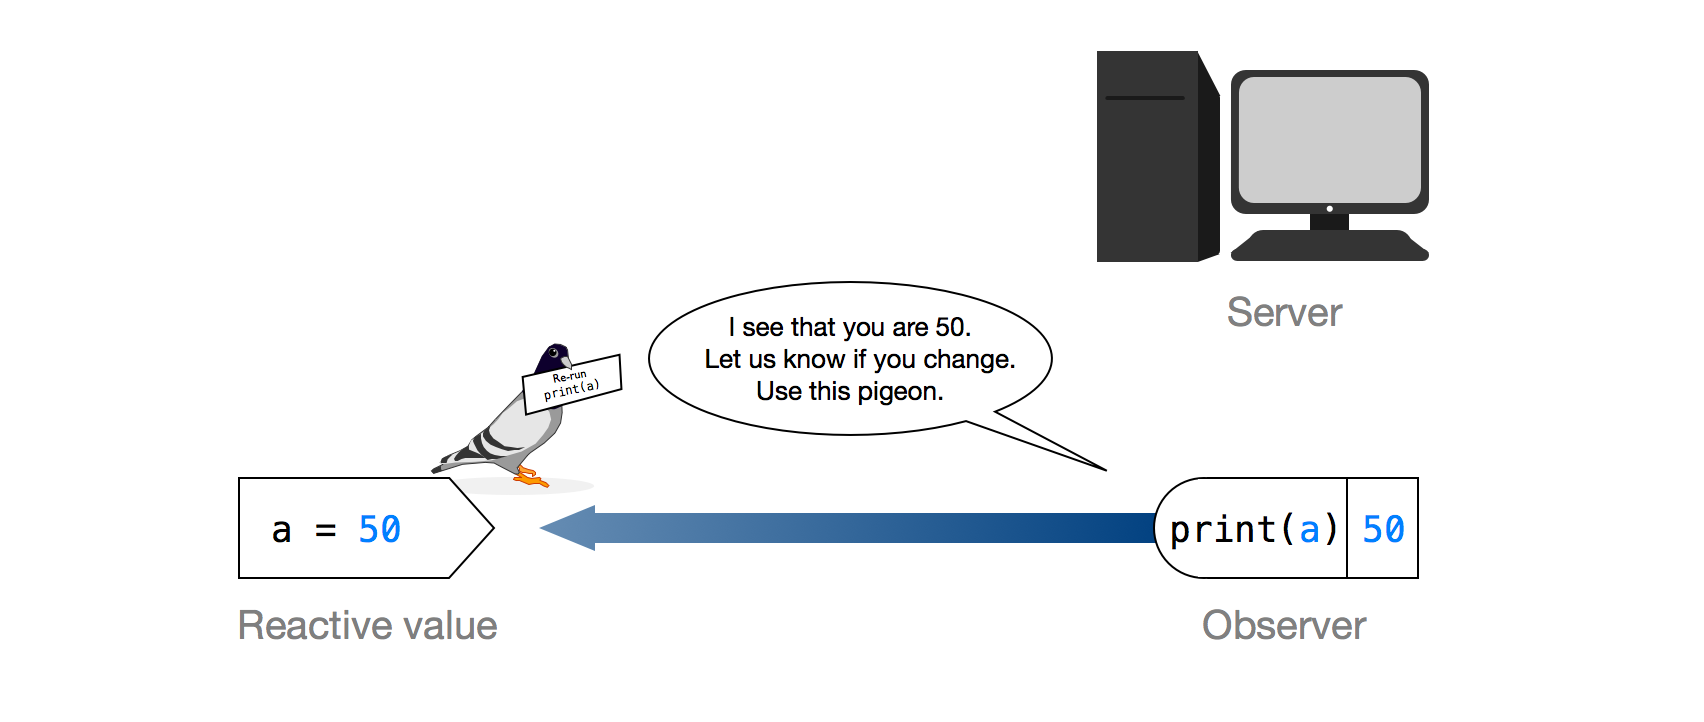
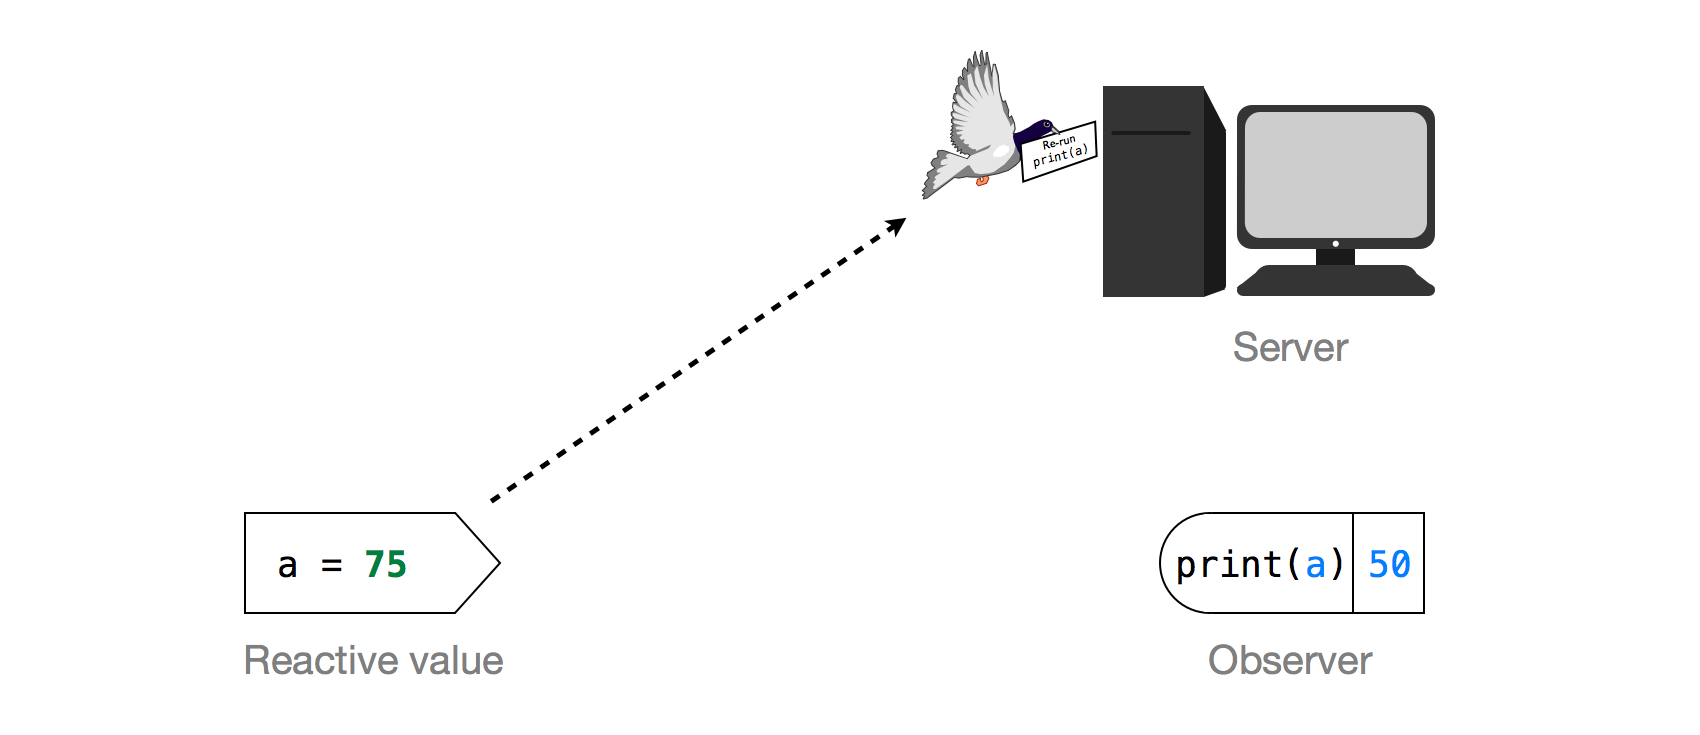
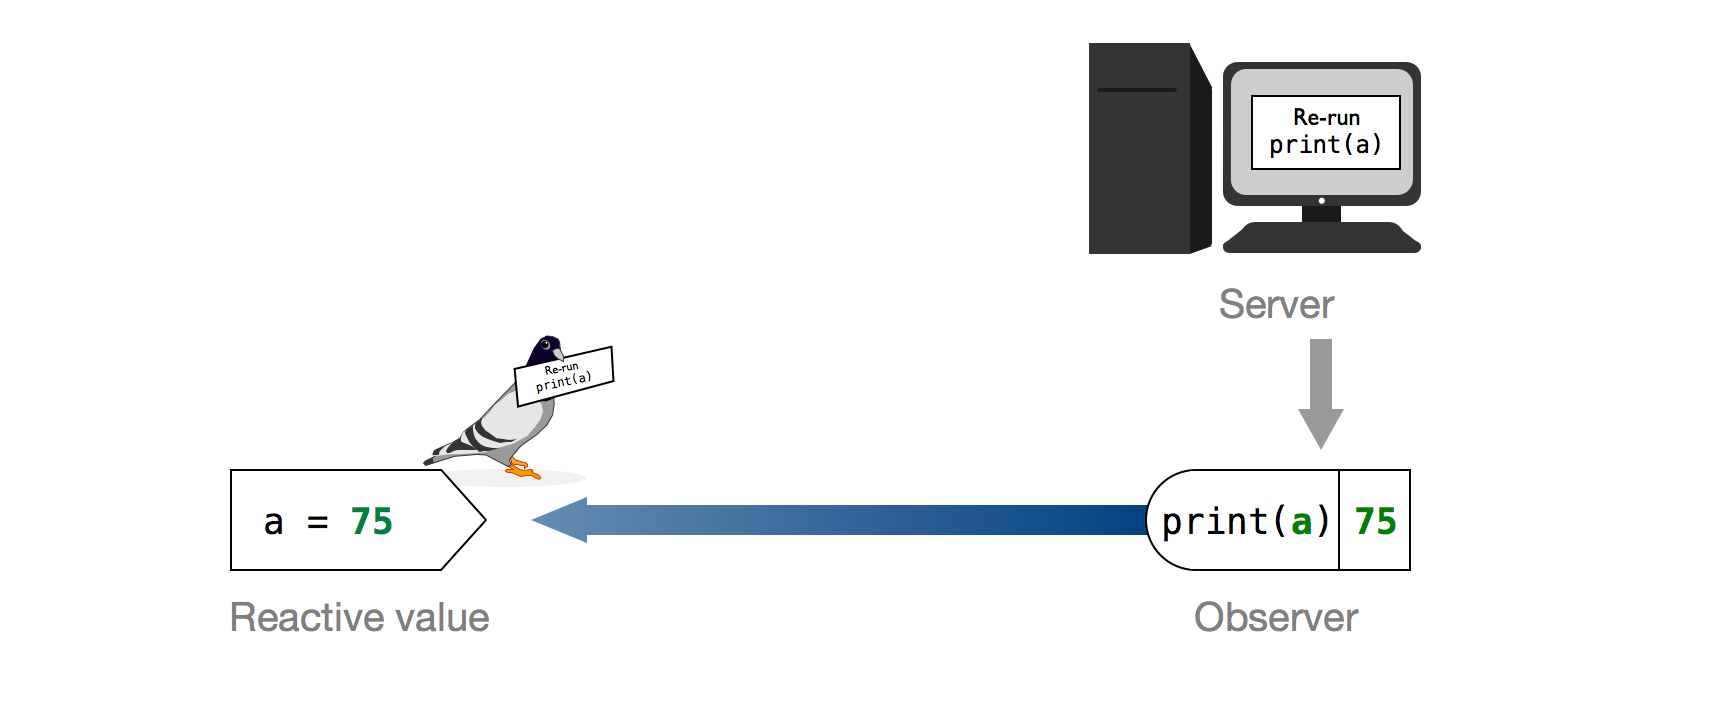
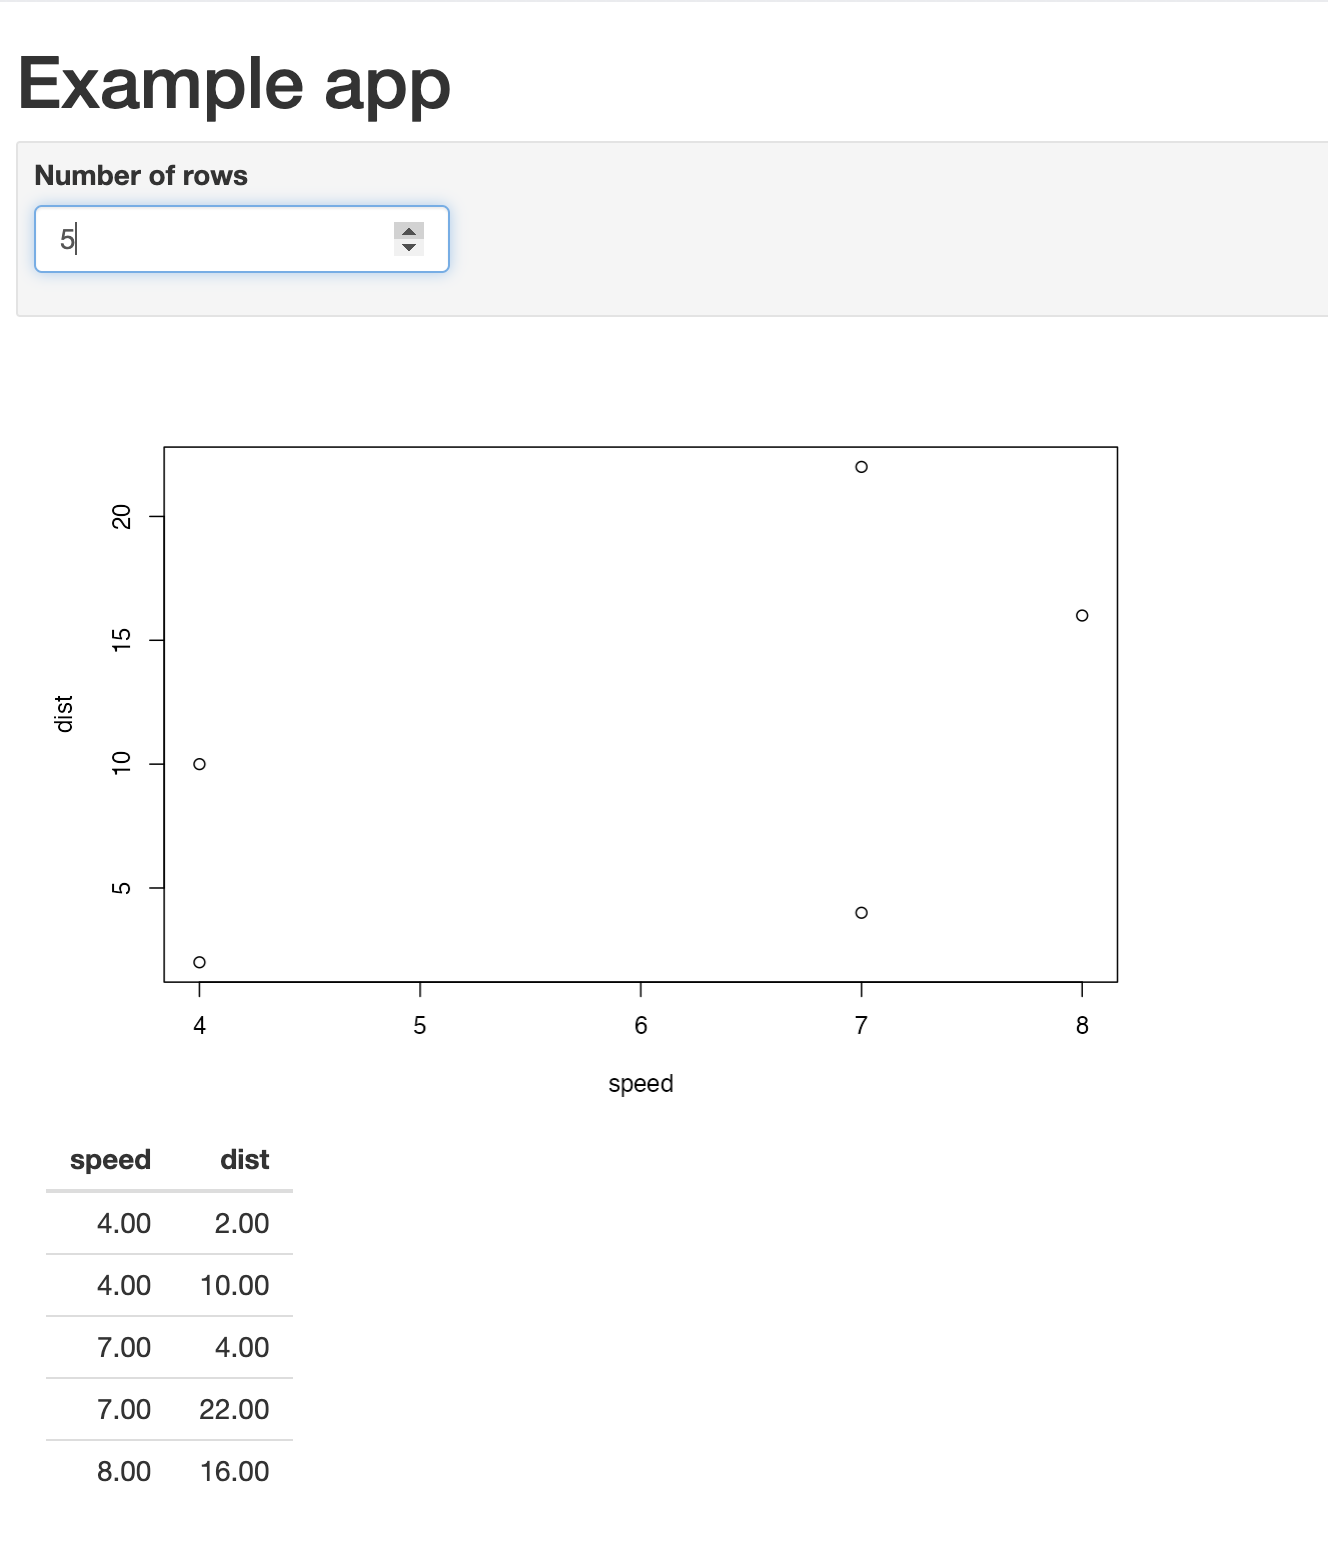
Every Shiny app has a webpage that the user visits, and behind this webpage there is a computer that serves this webpage by running R.
When running your app locally, the computer serving your app is your computer.
When your app is deployed, the computer serving your app is a web server.
Shiny vs. plotly
Shiny graphs need to be “connected” to RStudio or an Rstudio server
Why? Data sets are rewrangled and a new graphic is drawn
plotly isn’t changing the underlying data set/stats being displayed, can be displayed on webpage without an RStudio session
Getting started
Option 1: Embed a shiny plot/table in HTML docs
Need add runtime: shiny to your YAML header
Option 2: Can create an app.R file with a ui() and server() function
For template File > New File > Shiny Web App...
What’s in an app?
library(shiny)# other relevant libraries, read in data, data cleaning, etc if neededui <-fluidPage(# define inputs# define outputs)server <-function(input, output) { ...}`shinyApp( ui = ui, server = server)
User interface (ui) controls the layout and appearance of app (generates what the human sees and interacts with)
Server function (server) contains instructions needed to build app (tells the computer/server what to do with the “instructions” the human inputs into the UI)
shinyApp assembles the app and is what tells R that the code we wrote is intended to be a shiny app - make sure this line of code is at the end of your document
UI
Contains everything you see in the app
Inputs that allow the user to interact with the app
outputs generated by the app in different formats (text, tables, charts, images, etc.)
Also controls where inputs and outputs appear on the page
Server
Creates the outputs that appear on the page
Uses a set of instructions written via R functions and commands
Recall that outputs update automatically when we change input values in the UI
This is due to a concept known as reactivity (more later)
Your turn
In RStudio, follow the path File > New File > Shiny Web App... to open the shiny app template
Run the app by clicking “Run App” on the navigator bar above the R script
Identify the input(s) and output(s) that appear in the app
Return to the code. Which part of the shiny app (ui or server) creates the inputs and outputs? What functions are used to create them?
As seen, many types of inputs can be made using particular input functions
All input controls in shiny have two main parameters
inputId - must be unique
label - technically optional, but is what the user sees when interacting with that input in your app
Other parameters depending on exact input function
Creating Output Placeholders
Done in ui - these functions do not build outputs, they only create placeholders and indicate what type of output they will be (e.g. plot, table, text)
To reduce duplication, we can create a reactive expression for the data selected
server <-function(input, output, session) {# Creating a reactive expression for the data df <-reactive({head(cars, input$nrows) }) output$plot <-renderPlot({plot(df()) # Now we have to call df() like a function }) output$table <-renderTable({df() })}
Final details
Shiny apps need to be “connected” to RStudio or a remote RStudio server
You can deploy shiny apps online
using Posit’s cloud server (free/fee) - https://www.shinyapps.io/
creating a shiny server
Make sure that your app lives in its own folder and there are no other .R, .qmd, or .rmd files in that folder. The folder is what gets deployed.
Your turn - Modifying the geyser app
Histograms with one bin are not terribly informative - change the app so that the minimum number of bins a user can select is instead 5
Pick four colors. Modify the app to allow the user to select one of these colors for the histogram. Hint: use selectInput() in the ui and modify the hist() code in the server so that this input is used in place of darkgray
Add a textInput() that allows users to change the title of the histogram to whatever they specify
The faithful dataset contains a duration column as well. Add a second input and output to visualize the duration of eruptions.
Extra challenge: write code that allows the user to input minimum and maximum values for both duration and waiting time and outputs a scatterplot of that subset of data