[1] 3.0 3.0 27.5 8.4 59.0 3600.0 2.0 2.0Iteration II
Day 18
Prof Emily Kurtz
Carleton College
Stat 220 - Spring 2026
Recap from last class
forloops for iteration- Pre-allocating storage
- Creating an index vector
- Using
across()to iterate over columns
Example from last class - with code answers
We want to find the range of any quantitative variables, and the number of levels of any factor variables in the penguins dataset.
# A tibble: 1 × 8
  bill_length_mm bill_depth_mm flipper_length_mm body_mass_g  year species
           <dbl>         <dbl>             <int>       <int> <int>   <int>
1           27.5           8.4                59        3600     2       3
# ℹ 2 more variables: island <int>, sex <int>
Bakeoff data (season 14 only)
# A tibble: 76 × 7
   series episode baker  signature                  technical showstopper result
    <dbl>   <dbl> <chr>  <chr>                          <dbl> <chr>       <chr>
 1     14       1 Abbi   Foraged Poppy Seed, Lemon…         3 'Herbert t… Safe
 2     14       1 Amos   Blood Orange & Dark Choco…         2 'Orca on a… Elimi…
 3     14       1 Cristy 'Lemon Meringue' Vertical…         6 'Raspberry… Safe
 4     14       1 Dan    Rhubarb & Custard Vertica…         1 'Bruno' Ca… Star …
 5     14       1 Dana   'Salted Caramel Latte' Ve…        12 'My Amazin… Safe
 6     14       1 Josh   'Tropical' Vertical Layer…         8 'Mum's Hig… Safe
 7     14       1 Keith  'Dad's Chocolate Orange' …         4 'Maisie' C… Safe
 8     14       1 Matty  'Tiramisu' Vertical Layer…         7 'Marty the… Safe
 9     14       1 Nicky  'St. Clements' Vertical L…        10 'Always Be… Safe
10     14       1 Rowan  Chocolate & Raspberry Ver…         9 'Cosmopoli… Safe
# ℹ 66 more rows
Warm up
What does this chunk of code do? What will results look like?
results = character(10)

for(k in 1:10){
  eliminated = bakeoff |>
    filter(episode == k, str_detect(result, "Eliminated"))

  if(nrow(eliminated) == 1){
    results[k] = eliminated$showstopper
  } else if(nrow(eliminated) > 1){
    results[k] = str_flatten(eliminated$showstopper, collapse = ", ")
  } else{
    results[k] = "none"
  }
}
Warm up
 [1] "'Orca on a Wave' Cake"
 [2] "'Seaside Meal Deal' Illusion Biscuits"
 [3] "'My Favourite Tree' Plaited Centrepiece"
 [4] "none"
 [5] "'Gran's Garden Trio' Decorative Pies, 'Lattice Fabulous' Decorative Pies"
 [6] "'Stop and Smell the Rosé' Floral Dessert"
 [7] "'Flowers for my Bee' Meringue Bombe"
 [8] "'Marvellous Sweet Factory' Buffet"
 [9] "'Mango Mojito' Millefoglie"
[10] "none"
Warm up
results = character(9)

for(k in 1:10){
  eliminated = bakeoff |>
    filter(episode == k, str_detect(result, "Eliminated"))

  if(nrow(eliminated) == 1){
    results[k] = eliminated$showstopper
  } else if(nrow(eliminated) > 1){
    results[k] = str_flatten(eliminated$showstopper, collapse = ", ")
  } else{
    results[k] = "none"
  }
}
The good news: we can use across to do lots of for-loop-type tasks in our {dplyr} pipelines.
The bad news: across() only works with {dplyr} functions like mutate or summarize
The good news: there’s a more general-purpose solution in the {tidyverse}
Enhances the functional programming toolkit of R
Main function is
map, which allows you to replace manyforloopsLoaded with
library(tidyverse)

map()
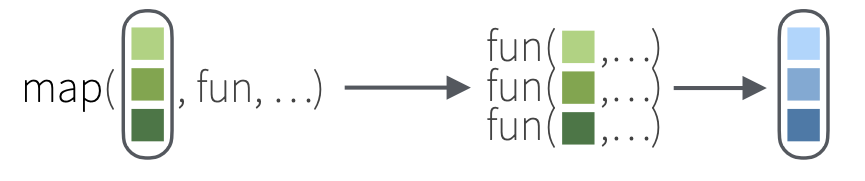
How does mapping work?
Suppose we have quiz 1 and quiz 2 scores of 4 students stored in a list…
…and suppose we want the results as a numeric (double) vector
map_something
Functions for looping over an object and returning a value (of a specific type):
map()- returns a listmap_lgl()- returns a logical vectormap_int()- returns a integer vectormap_dbl()- returns a double vectormap_chr()- returns a character vectormap_df()/map_dfr()- returns a data frame by row binding …
Try it: map
- Edit the code chunk below so it returns a numeric vector
- Edit the code chunk so it only
maps to the numeric columns (3-12) ofunscaled cancer
mapthesummaryfunction to all columns in the {palmerpenguins}penguinsdata
Example: bakeoff data
results = character(10)

for(k in 1:10){
  eliminated = bakeoff |>
    filter(episode == k, str_detect(result, "Eliminated"))

  if(nrow(eliminated) == 1){
    results[k] = eliminated$showstopper
  } else if(nrow(eliminated) > 1){
    results[k] = str_flatten(eliminated$showstopper, collapse = ", ")
  } else{
    results[k] = "none"
  }
}
eliminated_showstopper = function(ep_number){
bakeoff |>
filter(episode == ep_number, str_detect(result, "Eliminated")) |>
summarize(
n = n(),
showstopper = if_else(n > 0,
str_flatten(showstopper, collapse = ","), "none")) |>
pull(showstopper)
}
results = character(10)
for(k in 1:10){
results[k] = eliminated_showstopper(k)
} [1] "'Orca on a Wave' Cake"
[2] "'Seaside Meal Deal' Illusion Biscuits"
[3] "'My Favourite Tree' Plaited Centrepiece"
[4] "none"
[5] "'Gran's Garden Trio' Decorative Pies,'Lattice Fabulous' Decorative Pies"
[6] "'Stop and Smell the Rosé' Floral Dessert"
[7] "'Flowers for my Bee' Meringue Bombe"
[8] "'Marvellous Sweet Factory' Buffet"
[9] "'Mango Mojito' Millefoglie"
[10] "none" map vs for loop
Pros
- Don’t have to pre-allocate storage
- Don’t have to define an index
- Less error-prone
- Takes advantage of functional programming
Cons
- Hard to get used to if you’ve previously learned for-loops
- Often need to define a function
- Less fine-grained control
For this class, we’ll learn the basics of both and get practice on homework. For projects, you can use whichever approach makes more sense to you.
Your turn: map with penguins
Using the penguins data, use map to calculate the range of a numeric variable and the table of a factor variable. (It may be helpful to first write a custom function for this output)
Your result should be a list (it will have length 8).
More practice: survivor data
# A tibble: 870 × 7
   castaway_id castaway season_name      season place jury  finalist
   <chr>       <chr>    <chr>             <dbl> <dbl> <lgl> <lgl>
 1 US0001      Sonja    Survivor: Borneo      1    16 FALSE FALSE
 2 US0002      B.B.     Survivor: Borneo      1    15 FALSE FALSE
 3 US0003      Stacey   Survivor: Borneo      1    14 FALSE FALSE
 4 US0004      Ramona   Survivor: Borneo      1    13 FALSE FALSE
 5 US0005      Dirk     Survivor: Borneo      1    12 FALSE FALSE
 6 US0006      Joel     Survivor: Borneo      1    11 FALSE FALSE
 7 US0007      Gretchen Survivor: Borneo      1    10 FALSE FALSE
 8 US0008      Greg     Survivor: Borneo      1     9 TRUE  FALSE
 9 US0009      Jenna    Survivor: Borneo      1     8 TRUE  FALSE
10 US0010      Gervase  Survivor: Borneo      1     7 TRUE  FALSE
# ℹ 860 more rows
Write a function called
finaliststhat takes the input of a survivor season (as anumeric) and outputs a string of the finalists’ names for that season. The finalists’ names should be separated with a comma.Use
map_chrto return a character vector of finalists for seasons 31-40.
Simulation
Simulation
- Iteration is especially useful for simulation
- In statistics, we often work with a random sample to try to learn something about a population.
- We care about the uncertainty of our results: did we find a true trend, or could it be due to sampling variability?
Example: survivor data
If we randomly choose 20 previous survivor players to play on a new season, how likely are we to get zero finalists?
# A tibble: 1 × 1
      n
  <int>
1     2
The plan
- Write a function that runs our “experiment”
- Set up an iteration procedure to run our experiment a bunch of times
- Analyze the results
Write a function that runs our “experiment”
Set up a for loop to run our experiment a bunch of times
Analyze the results
n_finalists
    0     1     2     3     4     5     6     7     8
0.031 0.139 0.248 0.261 0.165 0.099 0.043 0.010 0.004
Same approach using map
- Define something to
mapover - Apply
sample_finalistsfunction to “something” - Analyze results
Same approach using map
Define something to map over:
unscaled_cancer
Recall the unscaled_cancer dataset from last week:
# A tibble: 569 × 12
        ID Class Radius Texture Perimeter  Area Smoothness Compactness Concavity
     <dbl> <chr>  <dbl>   <dbl>     <dbl> <dbl>      <dbl>       <dbl>     <dbl>
 1  8.42e5 M       18.0    10.4     123.  1001      0.118       0.278     0.300
 2  8.43e5 M       20.6    17.8     133.  1326      0.0847      0.0786    0.0869
 3  8.43e7 M       19.7    21.2     130   1203      0.110       0.160     0.197
 4  8.43e7 M       11.4    20.4      77.6  386.     0.142       0.284     0.241
 5  8.44e7 M       20.3    14.3     135.  1297      0.100       0.133     0.198
 6  8.44e5 M       12.4    15.7      82.6  477.     0.128       0.17      0.158
 7  8.44e5 M       18.2    20.0     120.  1040      0.0946      0.109     0.113
 8  8.45e7 M       13.7    20.8      90.2  578.     0.119       0.164     0.0937
 9  8.45e5 M       13      21.8      87.5  520.     0.127       0.193     0.186
10  8.45e7 M       12.5    24.0      84.0  476.     0.119       0.240     0.227
# ℹ 559 more rows
# ℹ 3 more variables: Concave_Points <dbl>, Symmetry <dbl>,
#   Fractal_Dimension <dbl>
Differences in groups
One question we might be interested in is “Is the radius of malignant tumors noticeably different than the radius of benign tumors?”
# A tibble: 2 × 2
  Class  mean
  <chr> <dbl>
1 B      12.1
2 M      17.5
This tells us the average difference within this sample, but we don’t know if this difference is “surprising” or not.
Permutation test
In a previous statistics class, you may have seen a permutation test for a difference in means.
Basic idea:
- Assume there is no difference in the groups
- Shuffle the group labels (benign/malignant) at random
- Compute the difference in means for the two groups
- Repeat the experiment a bunch of times
- Compare the observed difference to the distribution of simulated differences
If the observed difference is much bigger than the simulated differences, we have evidence of a statistically significant result
Your turn: Permutation test
- Define a function to run the experiment
- Create a new column of
unscaled_cancercalledclass_shuffled, which is a permutation of the originalClassvariable (Hint: seesamplefunction) - Group by
class_shuffledand compute the group means - Find the difference in the means
- Create a new column of
- Repeat the experiment 1000 times, making sure to save the difference in means
- Make a histogram of the simulated differences. How (un)likely is the difference we observed?