Github +
Reproducible
Reporting

Day 02

Prof Emily Kurtz

Carleton College
Stat 220 - Spring 2026

Plan for today:

  1. Questions about syllabus
  2. GitHub
    • Accessing your private repos
    • render ➡️ commit ✅ push ⤴️
  3. Reproducible Reporting

Github

Git + GitHub

  • Git is a version control system - like “Track Changes”, on steroids
  • It’s not the only version control system, but it’s a very popular one
  • GitHub is the home for your Git-based projects on the internet—like DropBox but much, much better
  • We will use GitHub as a platform for web hosting and collaboration

Why do we need it?

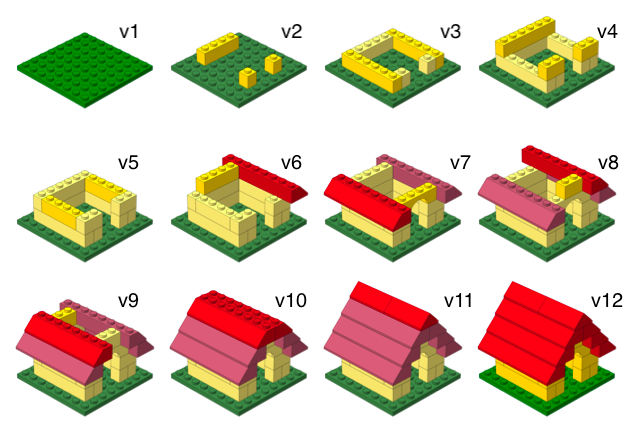
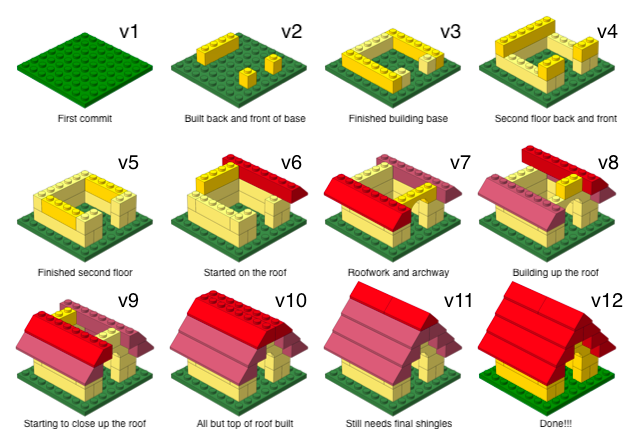
Versioning

Versioning (with human-readable messages)
How does it work for Stat220?
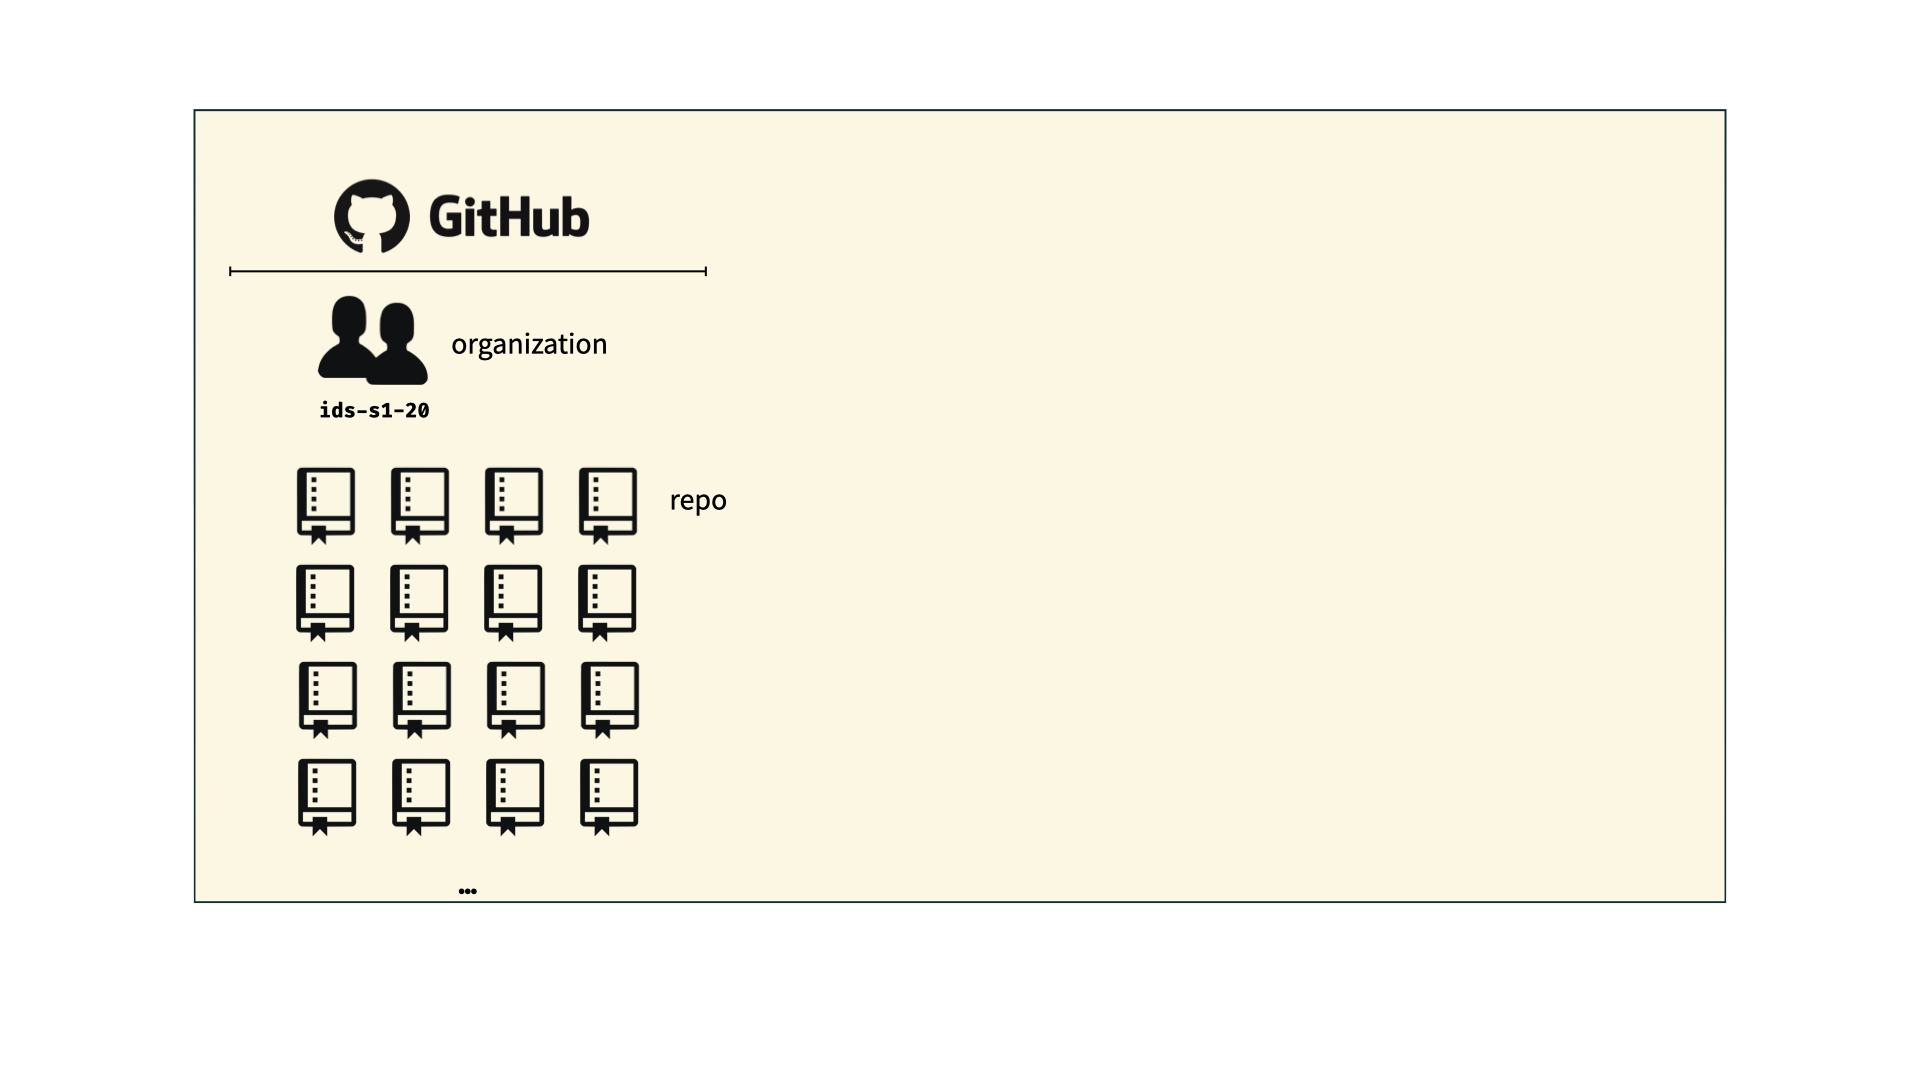
How does it work for Stat220?
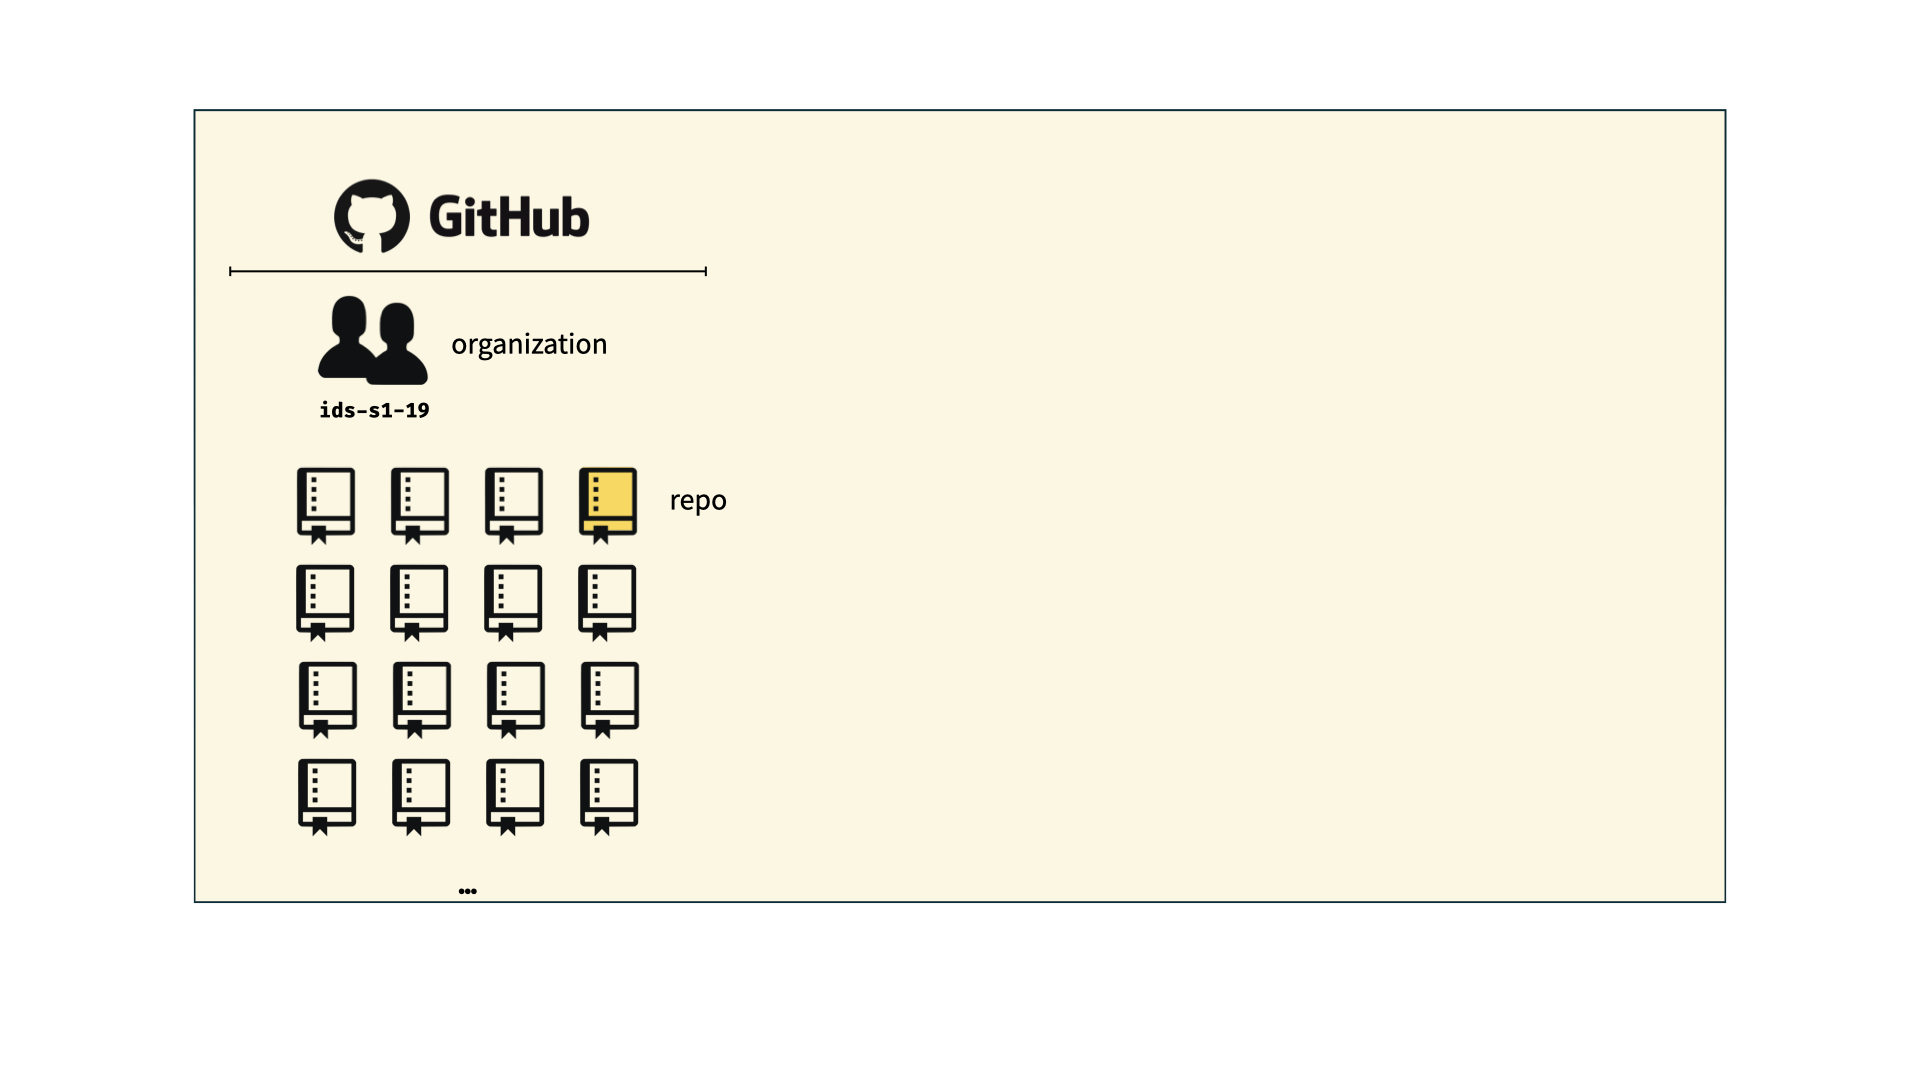
How does it work for Stat220?
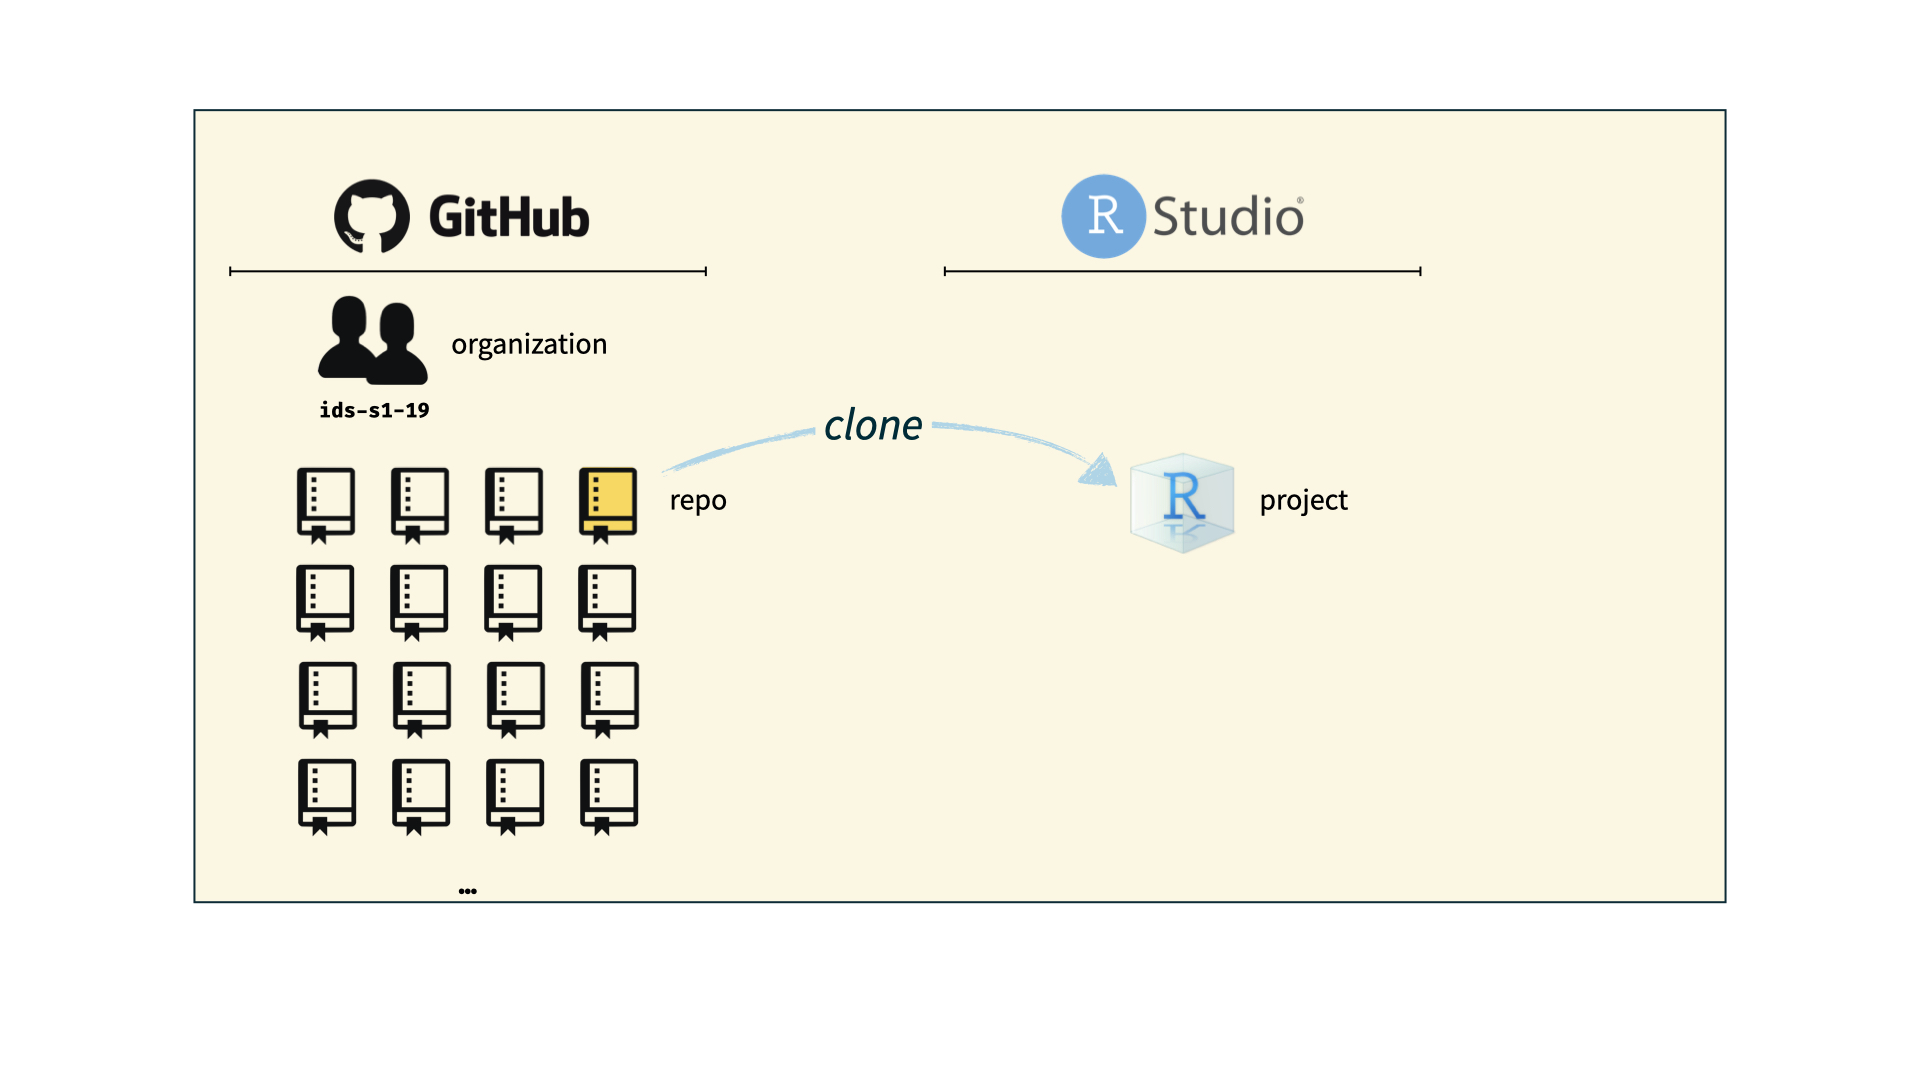
How does it work for Stat220?
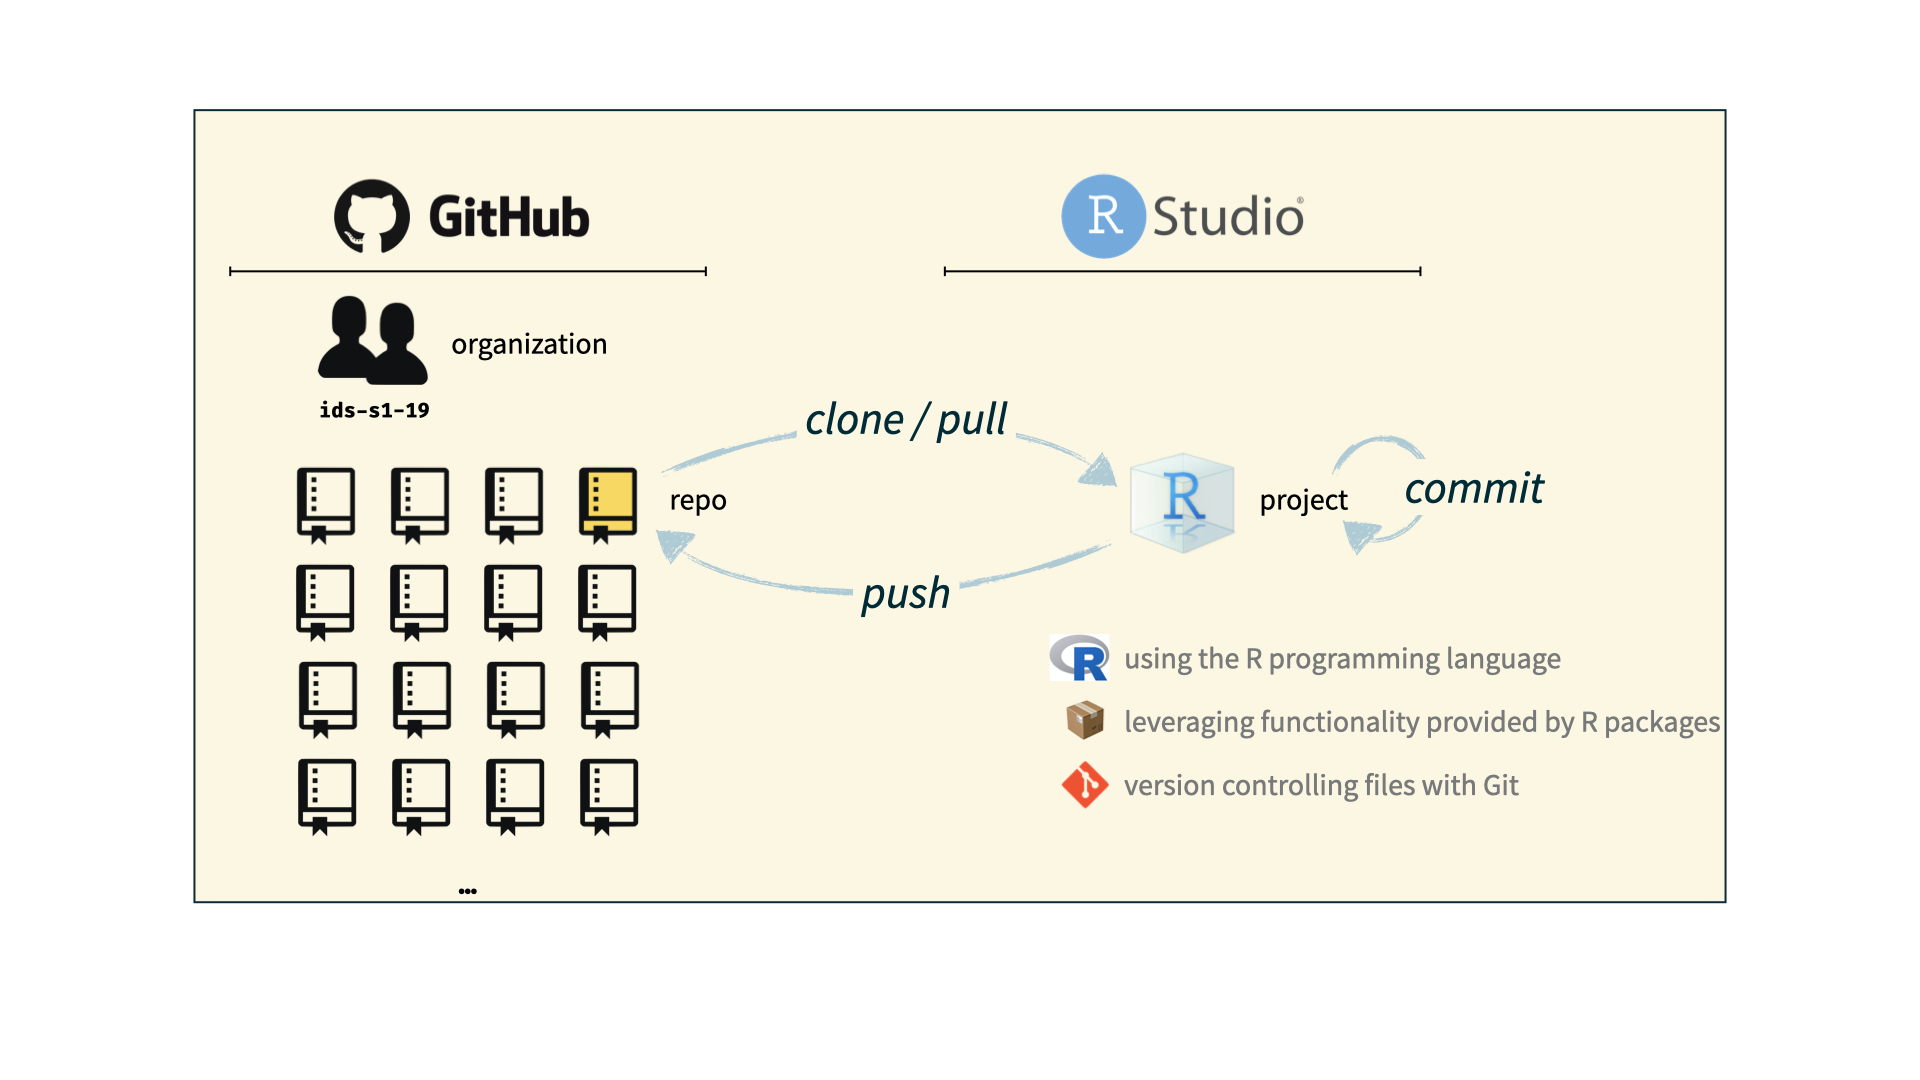
Let’s try it!

  • If you haven’t already, download GitHub Desktop and sign into your GitHub account on GitHub Desktop
    • To sign in, in GitHub Desktop, go to File > Options > Sign In > Continue with Browser, then sign in as usual
  • Follow the “Individual Assignment” directions at https://stat220kurtz.github.io/computing/git-stat220.html to access your hw01 repo and create an R project
  • Edit the .Rmd file:
    • Change “name” and “surname” to match your name
    • Add your education history under the Education section (note: we use # to add descriptive section headers for each section/code chunk)
  • Render ➡️ your changes, and commit and push them
  • View on github.com and confirm you can see your changes
  • Congrats! You have gotten started with your homework due Friday! Read more about what is expected for this homework in the README.md file contained in the repo after class

Help! I don’t have a hw01 repo

  • Never received GitHub invite → Fill out the Welcome survey
  • Never accepted GitHub invite → Look for it in your email and accept it
  • Opening repo in Rstudio fails → Make sure you have cloned the repo in GitHub Desktop
  • Still no luck? → Come to office hours or make an appointment with me!

Reproducible Reporting

Why do we need it?

Oops! I gave you the wrong set of data.

Why do we need it?

Other examples:

  • The results in Table 1 don’t seem to correspond to those in Figure 2.
  • In what order do I run these scripts?
  • Where did we get this data file?
  • Why did I omit those samples?
  • How did I make that figure?
  • “Your script is now giving an error.”
  • “The attached is similar to the code we used.”

Reproducible data science

Short Term Impact

  • Are the tables and figures reproducible from the code and data?
  • Does the code actually do what you think it does?
  • In addition to what was done, is it clear why it was done? (e.g., how were parameter settings chosen?)

Long Term Impact

  • Can the code be used for other data?
  • Can you extend the code to other things?

The toolkit

  • Scriptability \(\rightarrow\) R

  • Code environment \(\rightarrow\) RStudio

  • Literate programming (code, narrative, output in one place) \(\rightarrow\) Quarto

  • Version control \(\rightarrow\) Git / GitHub

What is Quarto?

  1. An authoring framework for data science.

  2. A document format (.qmd).

  3. A software package

  4. A file format for making dynamic documents with R.

  5. A tool for integrating prose, code, and results.

  6. A computational document.

Anatomy of a quarto doc

Chunk Options

What’s in .qmd:

```
test_function(20)
```

How it looks in rendered file:

test_function(20)
[1] 20
This is a message.
Warning in test_function(20): This is a warning!

What’s in .qmd:

```
#| message: false
test_function(20)
```

How it looks in rendered file:

test_function(20)
[1] 20
Warning in test_function(20): This is a warning!

What’s in .qmd:

```
#| warning: false
test_function(20)
```

How it looks in rendered file:

test_function(20)
[1] 20

What’s in .qmd:

```
#| echo: false
test_function(20)
```

How it looks in rendered file:

[1] 20
This is a message.
Warning in test_function(20): This is a warning!

What’s in .qmd:

```
#| eval: false
test_function(20)
```

How it looks in rendered file:

test_function(20)

Global options

Sometimes, you’ll want to set every chunk option at once. You can do so in the YAML header using execute:

---
title: "My report"
author: "Emily Kurtz"
execute:
  echo: false
---

Your Task

There’s an example HTML report on the schedule - UN report to replicate

Your task is to reproduce it in 02-example-unvotes.qmd

To be as reproducible as possible, you’ll need to use:

  • YAML metadata
  • Code chunks with appropriate options
  • Inline R code

You will also recreate the visualization at the bottom, but pick new countries that interest you.

Where do I find 02-example-unvotes.qmd?

You can find 02-example-unvotes.qmd on the schedule for today

Hints

  1. Use inline R code to replace “hard coding” the quantities, years, and country names that are highlighted below.
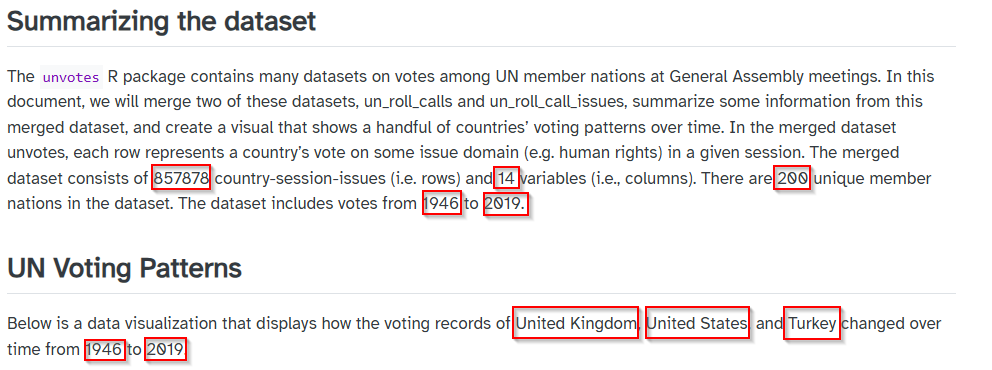
For example, instead of typing 857878 you would include nrow(unvotes) as an inline code chunk. Make sure the report knits and you get the right values.

  1. The .qmd file creating the report includes chunks of code - some of which may throw warnings - but of course the finished report does not show any of that. Edit the YAML header so that you don’t have to set options to suppress these features for each code chunk.